 GambleLore

Introduction to Poisson Distribution in Sports Betting
The Poisson distribution stands as one of the most reliable statistical tools for predicting the number of goals in soccer matches and other low-scoring sports. In 2026, sports bettors increasingly rely on data-driven methods to gain an edge over bookmakers. This comprehensive guide walks through every aspect of applying the Poisson distribution model, from core mathematics to practical implementation, real-world case studies, and integration with broader betting strategies. By mastering expected goals and probability outputs, you can identify value in over/under markets, correct score bets, and more. The approach emphasizes historical data analysis while accounting for variables like team form and external conditions, helping you generate consistent 2026 sports betting tips.
Many professional bettors use this model because it transforms raw statistics into actionable probabilities. Whether you are building your first model or refining an existing one, the following sections provide the depth needed for meaningful results.
Mathematical Basics of Poisson Distribution
The Poisson distribution models the probability of a specific number of independent events occurring within a defined period. In soccer, goals represent these events. The core formula is P(k) = (λ^k * e^(-λ)) / k!, where λ represents the average rate of goals per match and k is the exact number of goals predicted. This produces a probability for each possible goal total from zero upward.
For matches involving two teams, separate λ values are calculated for home and away scoring rates. These are then combined into a joint probability matrix covering all scorelines up to five or six goals per team. The resulting distribution allows calculation of win probabilities, draw likelihoods, and totals for over/under bets. Understanding the exponential decay in probabilities helps explain why high-scoring outliers remain rare in soccer.
Collecting Historical Match Data
Accurate predictions begin with high-quality data. Reliable sources include the Premier League official site, which supplies detailed goal, shot, and possession statistics. The FIFA website offers comparable data for international and club competitions worldwide. Aim to collect 25 to 40 matches per team, segmented by home and away performances, recent form streaks, and opponent quality.
Organize your dataset with columns for match date, venue, goals scored, goals conceded, shots on target, and key contextual notes. Free platforms like Google Sheets allow easy sorting and averaging. Cross-reference multiple seasons to capture league-wide scoring trends, such as average goals per game, which typically hover around 2.6 to 2.8 in top European leagues.
Step-by-Step Calculation Method
Follow this structured process to generate predictions:
- Compute each team’s average goals scored and conceded from the selected sample period.
- Adjust these averages using league-wide means to normalize for schedule strength.
- Derive expected goals (λ) for the specific fixture by multiplying adjusted rates.
- Generate individual Poisson probability tables for zero through five goals for each side.
- Multiply home and away probabilities to create the full score matrix and sum relevant cells for betting markets.
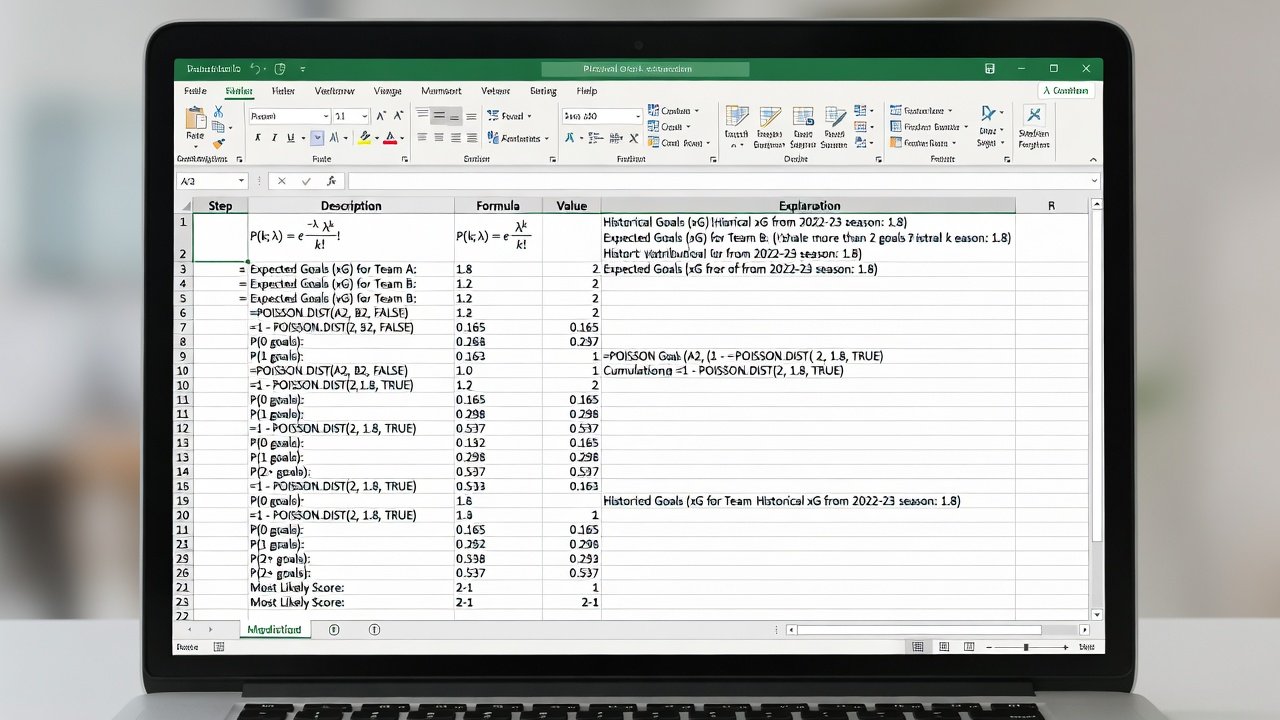
Consider a practical example: Team A averages 1.75 goals at home while Team B concedes 1.15 away. After opponent adjustment, expected goals become 1.68 for Team A and 1.22 for Team B. Running the Poisson formula yields probabilities such as 28% for a 1-1 draw and 22% for a 2-1 home win. These figures directly inform value comparisons against bookmaker odds.
Adjusting for Team Form, Home Advantage, and Weather
Basic averages require refinement to reflect current conditions. Apply a form factor derived from the last six matches, such as increasing λ by 12% for teams on a strong winning streak. Home advantage historically adds between 0.25 and 0.35 expected goals, depending on the league. Weather conditions matter for outdoor sports; heavy rain or wind can reduce total expected goals by 0.2 on average based on multi-year data patterns.
Document each adjustment in your spreadsheet and test sensitivity. Over-adjusting leads to unstable outputs, so limit modifiers to those supported by at least three seasons of evidence. This balanced approach improves accuracy when predicting matches affected by travel fatigue or extreme conditions.
Real-World Examples and Odds Comparison
Examine a hypothetical 2026 Premier League clash between mid-table sides. Historical data produces expected totals of 2.75 goals. The Poisson model assigns 41% probability to over 2.5 goals. If multiple bookmakers price this market at odds implying only 34% probability, the discrepancy indicates potential value. Track these edges across a season and record closing line value to measure true performance.
Another example involves a high-profile European match where one team shows improved defensive metrics. Adjusted λ values shift the most likely score from 2-1 to 1-1, altering recommended bets on both total goals and Asian handicap lines. Always compare your matrix against at least three different betting platforms before placing wagers.
Practical Tools: Spreadsheets and Free Calculators
Develop a reusable spreadsheet template in Excel or Google Sheets. Include dedicated tabs for raw data entry, λ calculations, Poisson tables, and automated matrix generation using built-in functions. Add conditional formatting to highlight value bets where your probability exceeds implied odds by more than 5%. Free online Poisson calculators provide quick verification, yet custom sheets deliver superior flexibility for incorporating form and weather adjustments.
Backtest your model on completed seasons to quantify accuracy rates, typically ranging from 52% to 58% on over/under selections after refinements. Update the model quarterly to reflect evolving league styles.
Common Pitfalls to Avoid
- Relying on fewer than 20 matches per team, which produces volatile averages and unreliable λ values.
- Neglecting variance in cup competitions or derbies where motivation differs from league play.
- Applying excessive adjustments without empirical support, leading to overfitting.
- Ignoring bookmaker margin when calculating true implied probabilities from odds.
- Failing to maintain detailed records of predictions versus actual outcomes for ongoing model improvement.
Integrating Poisson with Broader Betting Strategies
Combine Poisson outputs with other indicators for stronger decisions. Use goal totals for over/under and correct-score markets while deriving win probabilities for moneyline or double-chance bets. Layer the model with expected goals (xG) metrics from advanced stats providers to refine attacking and defensive ratings. For sustained 2026 profits, enforce strict bankroll rules such as risking no more than 2% per selection and only betting when your calculated edge exceeds the bookmaker’s margin.
Regularly review results across different leagues to identify where the Poisson approach performs best, such as in defensively oriented competitions versus high-scoring ones.
FAQ
How accurate is Poisson distribution for sports betting?
Calibrated models that include form and venue adjustments typically reach 55-60% accuracy on over/under predictions across major leagues, though individual seasons and lower divisions show greater variance.
When should you combine Poisson with other models?
Integrate Poisson outputs with Elo ratings or xG models particularly when analyzing teams with unusual tactical setups or during international tournaments featuring limited historical data.
Can Poisson work for sports beyond soccer?
Yes, the distribution applies effectively to hockey, rugby sevens, and other low-event scoring sports after minor calibration of the λ parameter.
What sample size delivers the most reliable predictions?
Between 25 and 40 matches per team provides an optimal balance between recency and statistical stability for most domestic leagues.
Conclusion
Applying the Poisson distribution systematically equips bettors with a repeatable framework for generating precise 2026 sports betting tips. Emphasize quality data collection, thoughtful adjustments, disciplined backtesting, and sound bankroll management to convert statistical insights into long-term profitability. Consistent application across multiple seasons separates successful model users from casual bettors.

No comments yet. Be the first!