 GambleLore

Introduction to Data-Driven Online Gambling
In 2026, successful online gambling increasingly relies on structured data analysis rather than intuition alone. Players who track sessions, analyze patterns, and adjust strategies based on real metrics gain a measurable edge. This tutorial provides a complete, practical guide to selecting tools, building dashboards, interpreting results, and managing risk responsibly. Data-driven approaches help identify profitable patterns, reduce unnecessary losses, and create repeatable processes that evolve with your experience. Whether you play slots, table games, or sports bets, applying analytics transforms random outcomes into informed choices. The following sections walk through each step with detailed examples you can implement immediately, covering everything from initial setup to advanced interpretation techniques.
Selecting Tracking Software for Online Gambling
Begin by identifying software that captures essential metrics such as bet size, win rate, session duration, and variance. Look for platforms that integrate with major casino APIs or allow manual CSV imports. Key features to evaluate include real-time syncing, customizable reports, and export options for further analysis in spreadsheets or external business intelligence tools. Consider compatibility with mobile devices since many gamblers play on smartphones and tablets during commutes or breaks. Privacy controls are equally important; choose software that offers local storage options or encrypted cloud backups to protect sensitive financial data.
Popular choices range from simple browser extensions to full business-intelligence suites. Test compatibility with your preferred gambling sites before committing. Always verify that the tool complies with local regulations and does not violate any platform terms of service. For instance, some free extensions provide basic logging while premium versions include automated alerts when your win rate drops below a set threshold. Evaluate user reviews on independent forums and check update frequency to ensure ongoing support for new game types and regulatory changes.
Setting Up Performance Dashboards
Once software is installed, create a centralized dashboard that visualizes your core KPIs. Start with a clean layout showing daily profit and loss, average bet size, and return-to-player percentage. Add filters for game type and time period so you can drill down quickly into specific sessions or game categories. Customize color coding to highlight positive versus negative trends, making it easier to scan large datasets at a glance.
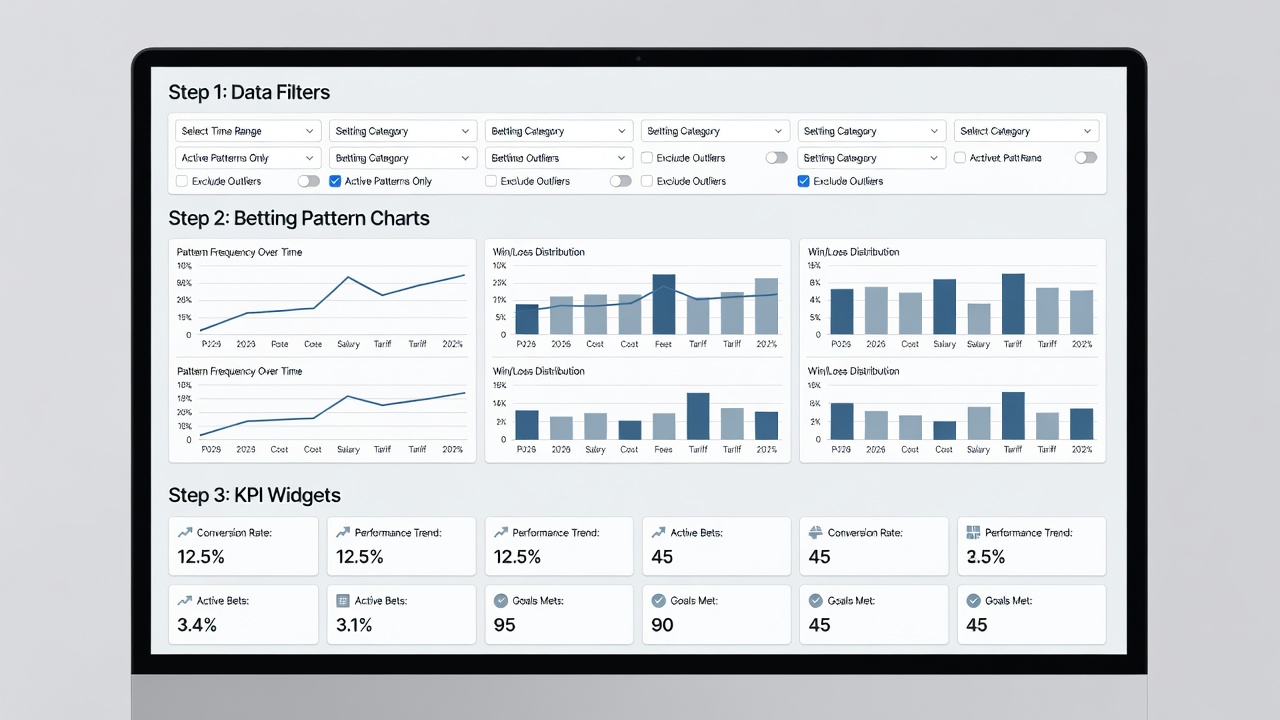
Connect your tracking source and set automated refresh intervals. Include conditional formatting that highlights sessions exceeding predefined loss thresholds. This visual approach makes it easier to spot trends without manually scanning rows of data. Build multiple views: one for overall bankroll health, another for individual game performance, and a third for time-based analysis such as hourly win rates. Test the dashboard with sample data from past sessions to refine layouts before live use. Regular updates to your dashboard settings ensure it remains aligned with your evolving betting strategy and risk tolerance levels.
Understanding Key Metrics in Depth
Core metrics form the foundation of any analytics system. Win rate measures success frequency while expected value calculates long-term profitability. Variance indicates how much results fluctuate around the average, helping predict drawdowns. Return to player percentage shows theoretical house edge over thousands of plays. Track these consistently and compare them across different games or bet types to allocate time and money more effectively. For example, a high variance game may require larger bankroll reserves even if the win rate appears attractive in short samples.
Interpreting Betting Patterns with Examples
Raw numbers become valuable only when interpreted correctly. Consider a 30-day sample of 150 sports bets. If your overall win rate sits at 52 percent yet your average odds are 1.85, the implied value calculation shows a positive expected return. Break the data further by bet type: pre-match versus live bets often reveal different success rates due to timing and information availability. Another example involves slot play. Tracking 2,000 spins across three titles might show one game delivering a hit frequency of 28 percent while another drops to 19 percent. Use this insight to allocate bankroll proportionally to the higher-frequency option during future sessions. Analyze streaks by reviewing consecutive wins or losses to adjust session length dynamically. Cross-reference patterns with external factors such as time of day or device used for additional context.
Comparing Free Versus Premium Tools
Free tools provide basic session logging and simple charts suitable for beginners. They typically lack advanced segmentation and API integrations that allow seamless data flow between platforms. Premium options add automated alerts, multi-account support, and deeper statistical modeling including regression analysis and predictive forecasting. The decision hinges on your volume and the complexity of your betting portfolio. Many users start free, then upgrade once data volume exceeds spreadsheet limits. Evaluate trial periods carefully to test whether premium features justify the investment for your specific needs.
Implementing Risk Adjustments Based on Data
Data reveals when to tighten or loosen your approach. If variance metrics indicate a prolonged downswing, reduce bet sizing by 30-50 percent until results stabilize. Conversely, a sustained positive edge may justify a modest increase in stake size while maintaining strict stop-loss rules. Document every adjustment and review outcomes after 50 additional bets. This feedback loop refines your risk model over time and prevents emotional overrides. Create a written risk policy that includes maximum session loss limits and minimum profit targets before scaling up. Review historical data monthly to identify seasonal or cyclical patterns that influence risk levels.
Case Studies from Real Sessions
One documented poker session tracked over eight hours showed a 14 percent ROI when the player folded marginal hands early based on dashboard alerts. Another sports-betting case study highlighted a shift from 1.70 average odds to 2.10 after filtering for value bets identified through historical analysis, resulting in improved long-term yield. A slots player used variance tracking to switch from high-volatility titles to medium-volatility ones during a 500-spin sample, reducing bankroll swings by nearly half while maintaining similar overall returns. These examples illustrate how consistent data review leads to tangible improvements across game types.
Common Mistakes to Avoid
Many beginners overfit their models to small sample sizes, leading to unreliable conclusions. Others ignore variance and chase losses based on short-term results. Failing to update software or dashboard filters can introduce outdated metrics. Always validate findings with larger datasets and seek second opinions from experienced data users when patterns seem unusual.
FAQ: Data Privacy Concerns in Gambling Analytics
- How is my data stored? Reputable tools use end-to-end encryption and allow local-only storage options to minimize exposure.
- Can casinos access my analytics? Most tools operate independently; however, always review permissions before granting API access and read privacy policies thoroughly.
- What happens if I delete my account? Leading platforms provide complete data export and permanent deletion features within 30 days of request.
- Are there legal considerations? Check your jurisdiction's rules on data collection and third-party tracking before integrating any tool.
For broader guidance on digital privacy, consult resources such as MDN Web Docs, World Health Organization, and Centers for Disease Control and Prevention.
Conclusion
Applying analytics to online gambling creates a repeatable, evidence-based process. By selecting appropriate software, building clear dashboards, interpreting patterns accurately, and adjusting risk dynamically, players move from reactive play to strategic decision-making. Begin with one or two core metrics today, expand gradually, and review results monthly to maintain continuous improvement. Consistent application of these methods supports better bankroll management and more enjoyable, controlled gambling experiences over the long term.


No comments yet. Be the first!