 GambleLore

Introduction to MTT Result Analysis in 2026
Texas Hold'em multi-table tournaments (MTTs) demand constant refinement, and 2026 brings new meta shifts that reward data-driven players. This guide walks you through a repeatable process for reviewing results to uncover actionable improvements. By tracking performance across stages and comparing against current benchmarks, you can eliminate leaks and boost profitability over time. Systematic analysis separates recreational players from consistent winners who treat tournaments like a professional endeavor rather than isolated sessions.
Core Metrics Every MTT Player Must Track
Start with foundational stats that reveal overall health and stage-specific tendencies. Return on Investment (ROI) shows long-term edge, while In The Money (ITM) rate highlights consistency. Voluntarily Put Money In Pot (VPIP) broken down by early, middle, and late stages exposes where your ranges loosen or tighten inappropriately. Additional metrics include average stack depth at bust-out, aggression factor post-flop, and fold-to-3-bet rates. Segment these by buy-in level and field size for clearer patterns. For instance, a strong overall ROI can mask weak late-stage play that costs final-table equity. Track big-blind win rate in different positions and average profit per tournament hour to understand sustainability. Players who monitor these metrics closely often notice that early-stage passivity leads to missed value opportunities, while late-stage over-aggression creates unnecessary variance.
Exporting and Segmenting Data from Major Sites
Major platforms like PokerStars and GGPoker allow CSV exports of hand histories and tournament summaries. Download data monthly, then import into tools such as PokerTracker 4 or Hold'em Manager 3. Filter by date range, stake, and stage to create custom reports. Use tags for specific scenarios like bubble play or final-table ICM decisions. Cross-reference with population databases to see how your VPIP compares in similar spots. This segmentation turns raw numbers into targeted insights rather than vague impressions. Break results into early (first three levels), middle (antes in play), and late (bubble and beyond) phases to isolate where edge erodes.
Recommended Tools and Software for Deep Analysis
Beyond basic trackers, consider integrating ICM solvers and equity calculators. Software like ICMIZER helps model final-table scenarios with precise stack distributions. Combine this with database queries that isolate hands where you reached certain stack depths. Free options include building custom Excel dashboards that calculate stage-specific ROI automatically. Many serious players maintain separate spreadsheets for each buy-in tier to avoid skewed aggregates. When exporting, always include player notes and opponent tendencies if the platform supports them, as these add qualitative layers to quantitative data.
Spotting Leaks in Early Versus Late Stages
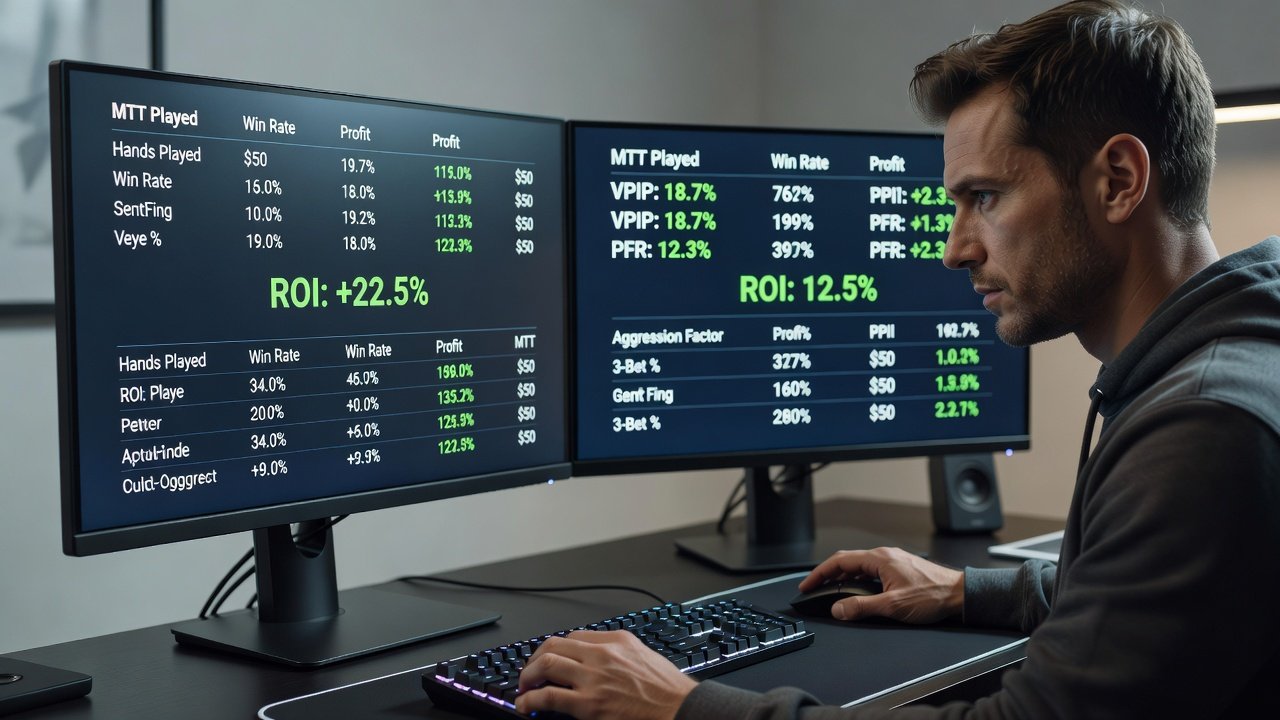
Early-stage leaks often appear as overly tight VPIP when antes are absent, missing value with strong hands. Late-stage issues surface through excessive calling ranges near the bubble or incorrect shove-fold decisions with short stacks. Review hand histories where you busted outside the money and tag recurring mistakes like limping weak hands or failing to 3-bet bluff. For example, if your early-stage VPIP sits at 12 percent while the field average hovers near 18 percent, you may be folding too many speculative hands in position. Late-stage analysis might reveal that you call 25 percent of raises when the average successful player defends only 15 percent, indicating over-defending against wide ranges.
Comparing Personal Stats to 2026 Meta Benchmarks
Current 2026 meta data from large player pools shows average ITM rates around 18-22 percent for mid-stakes MTTs and ROI targets of 25-35 percent for winning regulars. Compare your stage-specific VPIP against these to identify outliers. If your late-stage VPIP exceeds population norms by more than 8 percent, tighten opening ranges and increase 3-bet frequency. Resources like PokerNews publish regular strategy updates reflecting evolving solver outputs and population trends. Additional benchmarks appear on sites such as Card Player, where contributor articles often share anonymized database statistics from major networks. Revisit these comparisons quarterly because meta shifts can occur rapidly with new solver releases or format changes.
Turning Insights into Adjusted Poker Strategies
Once leaks are identified, create deliberate practice drills. If early-stage VPIP is too low, expand button steals by 5 percent and track results over 50 tournaments. Adjust late-stage aggression by studying ICM spots with tools like ICMIZER. Re-test after 100 tournaments to measure ROI change. Document every adjustment in a dedicated journal that includes the rationale, expected outcome, and actual results. This creates an audit trail that prevents repeating ineffective tweaks.
Step-by-Step Example of a Result Breakdown
Export 150 MTTs from Q3 2026. Filter for $50-plus buy-ins and calculate ROI at 28 percent. Break VPIP into early 14 percent, middle 19 percent, and late 31 percent. Population comparison shows late VPIP 6 percent too high. Review 40 bust hands; 12 feature marginal calls on the bubble. Tweak by tightening late ranges and raising 3-bet frequency. Next 50 tournaments show ITM rising from 19 percent to 24 percent. Extend this process by calculating average profit per stage and noting specific hand examples that illustrate the improvement.
Before-and-After Strategy Tweaks
Before analysis, Player A posted 22 percent ROI but bled chips in final three tables due to loose calling. After segment review and range tightening, ROI climbed to 37 percent over the following quarter with fewer marginal spots. Track every change with before-and-after reports to confirm cause and effect. Another player reduced early-stage folding frequency after noticing zero profit in the first levels across 80 tournaments, leading to a 12 percent overall ROI increase within four months.
Common Mistakes and How to Avoid Them
Many players review results sporadically or focus only on winning sessions. Avoid this by scheduling fixed review blocks every 30 tournaments. Another pitfall involves ignoring sample size; always wait for at least 100 events before declaring a leak fixed. Over-reliance on a single metric such as ROI without context can also mislead. Balance quantitative data with qualitative review of key hands to maintain perspective.
Short FAQ on Avoiding Common Review Pitfalls
- How often should I review results? Monthly deep dives combined with weekly spot checks prevent data overload while catching trends early.
- Should I ignore small sample sizes? No—flag them but wait for 100-plus tournaments before major adjustments.
- Is software required? Free spreadsheets work for beginners, but dedicated trackers accelerate segmentation and benchmarking.
- How do I handle variance? Focus on process metrics like VPIP and aggression rather than short-term ROI swings.
- What if results contradict my intuition? Prioritize data over feelings and test adjustments in low-stakes events first.
Reviewing MTT results systematically transforms guesswork into precise strategy evolution. Consistent application of these steps positions you ahead of the 2026 field by turning every tournament into a learning opportunity that compounds over hundreds of events.
Apply these principles alongside broader gambling strategies for consistent results.


No comments yet. Be the first!