 GambleLore

Introduction
In 2026, players seeking an edge in online slots are turning to data analytics rather than superstition. This guide shows how to leverage publicly available statistics from reputable trackers to evaluate slot machines based on measurable performance indicators. By focusing on hit frequency, bonus trigger rates, and other metrics, you can make informed choices that maximize entertainment value and potential returns. The approach moves beyond simple RTP checks by collecting, organizing, and comparing data across multiple games to identify consistent payout patterns while avoiding myths about hot machines. Players who adopt these techniques often experience more structured sessions and better bankroll management over time.
Advanced analysis involves sourcing verified data sets, building comparison tools, and applying findings to real gameplay decisions. This method helps distinguish between slots that deliver frequent small wins versus those with rarer but larger payouts, aligning choices with personal preferences and risk tolerance.
Key Metrics for Slot Evaluation
Hit frequency measures how often a slot produces any winning combination, typically expressed as a percentage. A higher hit frequency often signals more frequent small wins, which suits players preferring steady play sessions. Bonus trigger rates track how regularly special features activate, directly impacting overall excitement and payout potential. Additional metrics include volatility indicators that show payout variance and average spins between bonuses. These figures, when combined, provide a fuller picture than RTP alone. For instance, a slot with 30% hit frequency and a bonus every 120 spins might outperform one with lower activity despite similar RTP values. Players should also consider return-to-player percentages adjusted for recent updates and sample sizes from large data pools. Comparing these across providers reveals patterns in game design that affect long-term play experiences.
Sourcing Reliable Data from Trackers
Reputable sources aggregate player-submitted results from thousands of sessions. Start with established slot tracking platforms that publish anonymized statistics updated regularly. Cross-reference multiple trackers to verify consistency and reduce bias from small sample sizes. Always filter for recent data covering at least several thousand spins. Older information may not reflect current game versions or provider updates. Government-regulated sites and independent auditing bodies offer additional context on game fairness; for example, consult the UK Gambling Commission for licensed operator standards. Another valuable resource is BeGambleAware, which provides guidance on responsible play alongside industry data insights. Look for trackers that detail methodology, including how they handle outliers and verify submissions. This ensures the numbers you use are robust enough for decision-making.
Building Simple Comparison Spreadsheets
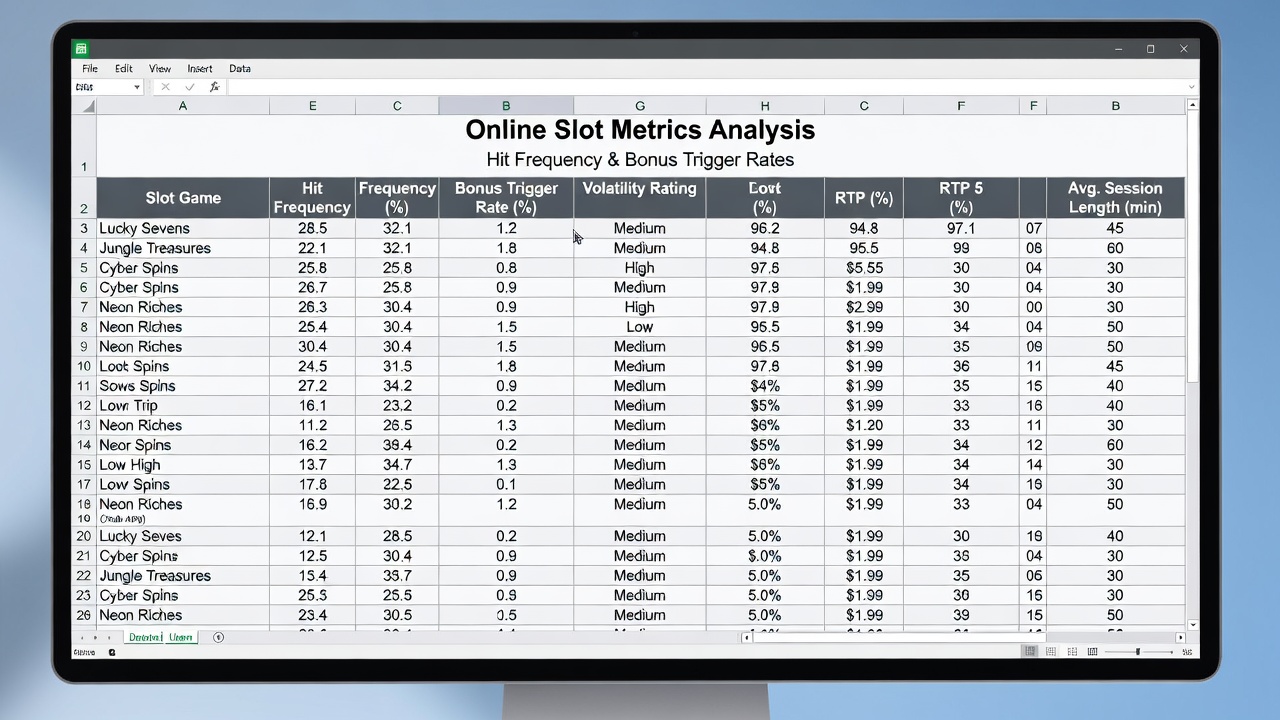
Create a spreadsheet with columns for game name, provider, hit frequency, bonus trigger rate, volatility rating, and calculated value score. Import data from trackers, then use formulas to rank games by your chosen criteria, such as bonus frequency per 100 spins. Apply conditional formatting to highlight top performers and sort rows dynamically. Update the sheet weekly with fresh tracker exports. This method allows quick side-by-side comparisons and reveals trends over time that single-session play cannot show. Add filters for game type or jackpot inclusion to narrow options quickly. Include a notes column for personal observations from test spins. Over several weeks, the accumulated data forms a personalized database that improves selection accuracy. For deeper analysis, incorporate pivot tables to summarize average metrics across providers or volatility levels, turning raw numbers into actionable rankings.
Real-World Examples of Data Application
Consider two popular slots from the same provider. Tracker data might show Slot A triggers bonuses every 85 spins on average with 28% hit frequency, while Slot B requires 150 spins between bonuses but offers higher average win sizes. A player favoring frequent features would select Slot A based on this analysis. Another example involves progressive jackpot slots. By monitoring jackpot contribution rates alongside base game metrics, you can determine whether the added jackpot value justifies the slightly lower base RTP. In one case study, data revealed a mid-volatility slot with improving bonus rates after a provider patch, leading players to prioritize it over older titles. A third scenario compares three video slots where spreadsheet rankings highlighted one game with superior hit frequency during peak hours, guiding session timing decisions. These examples demonstrate how raw metrics translate into practical choices that enhance play quality without relying on luck alone.
Common Pitfalls to Avoid
- Relying on small sample sizes that skew results dramatically.
- Ignoring game updates that alter payout structures.
- Confusing short-term variance with long-term expected performance.
- Overlooking licensing and regulatory compliance when selecting platforms.
- Failing to account for regional differences in game versions across casinos.
- Over-optimizing for one metric while neglecting overall entertainment value.
Always verify tracker methodology and sample sizes before drawing conclusions. Combining data with responsible bankroll management prevents over-reliance on any single metric and supports sustainable play habits.
Integrating Data with Progressive Jackpots
Progressive slots add complexity because jackpot size fluctuates. Track the current jackpot level relative to its seed amount and contribution percentage. Data analytics helps calculate break-even points where the progressive element offsets any base game disadvantages. Compare multiple progressives using spreadsheets that factor in both standard metrics and jackpot probability estimates. This layered approach identifies opportunities where the total expected value peaks. Monitor historical jackpot win frequencies from trackers to estimate realistic timelines. Players can then time entries during periods when jackpots exceed average thresholds, balancing risk with potential upside. Regular updates to your tracking sheet ensure decisions remain based on current conditions rather than outdated assumptions.
Step-by-Step Guide to Analyzing a New Slot
Begin by locating the game on multiple trackers and recording baseline metrics. Next, simulate 500 spins in demo mode while logging outcomes manually for cross-verification. Input findings into your spreadsheet and compare against similar titles. Finally, test with small real-money bets only after confirming positive indicators. Repeat this process for any new release to build a comprehensive library over time.
FAQ
How accurate is publicly available slot data?
Accuracy depends on sample size and tracker reputation. Large aggregators using verified player reports tend to be reliable, but always cross-check with multiple sources and treat figures as estimates rather than guarantees. Sample sizes below 10,000 spins often introduce significant variance that can mislead casual analysis.
Can data analytics be combined with progressive jackpot strategies?
Yes. Monitor both base metrics and jackpot growth simultaneously. Use spreadsheets to model scenarios where the growing jackpot improves overall expected value, helping time your play during favorable jackpot ranges. This integration requires consistent data refreshes to remain effective.
Do I need advanced technical skills for this analysis?
Basic spreadsheet functions suffice for most players. Focus on simple averages, sorting, and conditional formatting rather than complex programming unless you aim to automate large datasets. Many free tools provide templates that simplify initial setup.
What role does responsible gambling play in data-driven slot selection?
Data techniques enhance informed decisions but must pair with strict session limits and self-exclusion options when needed. Resources like the UK Gambling Commission emphasize balancing analytics with awareness of potential risks.
Conclusion
Data analytics transforms slot selection from guesswork into a structured process. By consistently applying metrics like hit frequency and bonus rates through spreadsheets and reputable trackers, players gain clearer insights into game behavior. Remember to combine these techniques with responsible gambling practices for the best long-term experience. Regular refinement of your methods ensures continued relevance as new slots and data sources emerge in 2026.


No comments yet. Be the first!