 GambleLore

Introduction to NBA Betting Odds Research in 2026
Researching NBA betting odds effectively requires a structured approach that combines data analysis, market awareness, and disciplined interpretation. In the 2026 season, bettors who master these steps gain an edge by identifying discrepancies between lines and true probabilities. This guide provides a complete walkthrough, incorporating practical checklists and scenarios from the current campaign to help readers build repeatable processes.
Understanding odds movement starts with recognizing how sportsbooks set initial lines based on advanced metrics and injury reports. Cross-referencing techniques used in football betting or tennis bets can broaden perspective on line shopping without direct parallels. The 2026 schedule features expanded international games and a compressed mid-season tournament, creating unique research opportunities around travel fatigue and rest advantages.
Selecting Reliable Data Sources for 2026 NBA Odds
Begin every research session by gathering information from trusted platforms. Official league resources and statistical databases deliver foundational data. The NBA official site supplies injury updates and schedule details essential for contextualizing odds. Supplement this with comprehensive historical stats available at Basketball-Reference.
Additional sources include advanced analytics sites that track pace, efficiency ratings, and player tracking data. Always verify line movements across multiple sportsbooks to detect consensus shifts. For 2026, focus on real-time APIs where available to capture live adjustments during the season. Incorporate weather-independent factors like arena altitude for teams traveling to high-elevation venues, and review referee crew assignments that influence foul rates and game pace.
Interpreting Betting Lines and Key Metrics
Once data is collected, interpret lines by examining point spreads, moneylines, and totals. A line movement of more than 1.5 points often signals sharp money entering the market. Calculate implied probabilities from odds to compare against your own projected outcomes derived from team efficiency differentials. Break down spreads into projected margins by factoring in home-court advantage, which averages around three to four points in most matchups.
Public stats such as points per game and rebounding percentages provide surface-level insights, yet deeper metrics like offensive rating and defensive rating adjusted for pace reveal hidden value. Use these to build models that project game totals before comparing them to the posted number. In 2026, pay special attention to three-point attempt rates and transition efficiency, as rule emphasis on physicality has shifted defensive schemes league-wide.
Identifying Sharp Action Signals
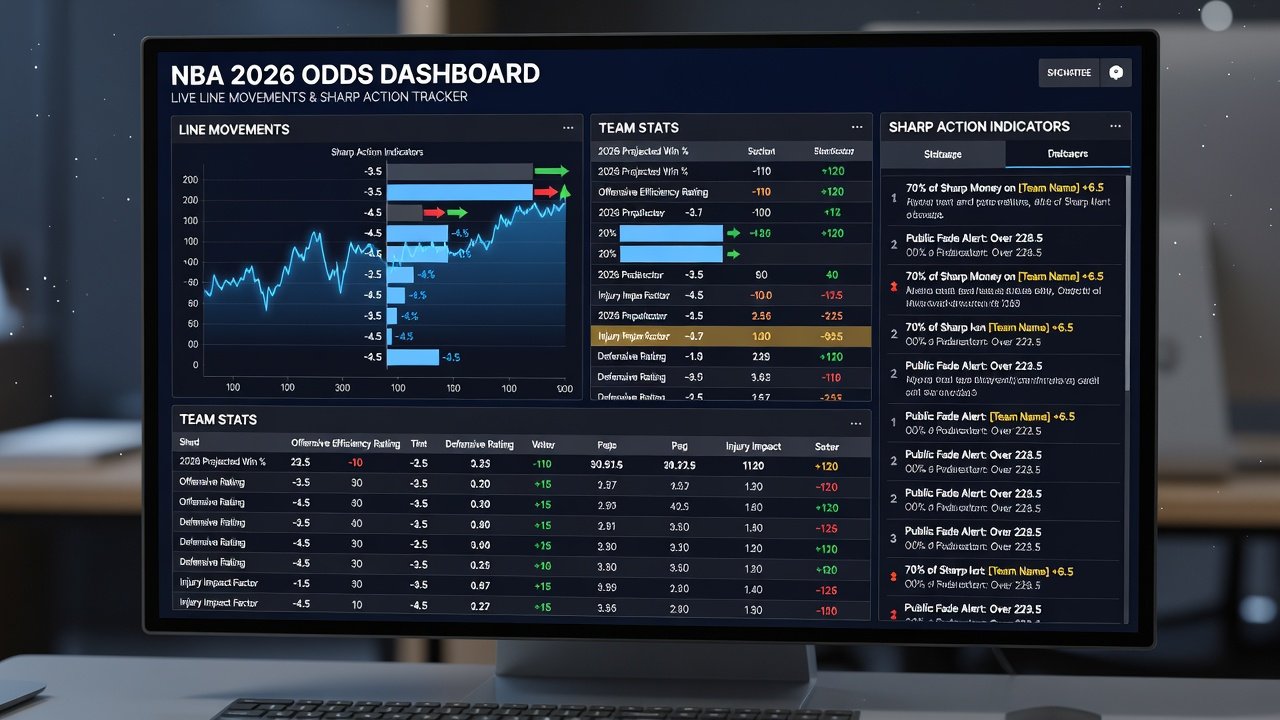
Sharp action manifests through rapid line movement accompanied by high betting volume at respected books. Monitor steam moves where lines jump simultaneously across markets. In 2026 scenarios, for instance, a sudden shift on an underdog after a key player injury report often indicates professional bettors reacting first. Track reverse line movement where the line moves opposite to heavy public betting percentages, a classic sign of informed money.
Checklists for spotting sharp signals include: reviewing line history for steam patterns over multiple sportsbooks, noting timing relative to injury announcements or practice reports, confirming with betting percentage splits from reputable trackers, and observing limits being lowered at sharp-friendly books. These indicators help distinguish noise from informed wagering. Additional signals appear in futures markets when rotation occurs between correlated props and main game lines.
Using Public Stats Effectively
Public statistics serve as a starting point but require careful filtering. Focus on recent form over full-season averages, especially during back-to-back games or travel-heavy stretches common in the NBA schedule. Cross-check box scores against advanced tracking data to avoid misleading narratives from blowout games or garbage time production.
Practical application involves creating simple spreadsheets that compare team performance in specific situations, such as road games following a loss or contests against top defensive units. Analyze situational splits like performance after overtime games or on the second night of back-to-backs. This method uncovers consistent edges without overcomplicating the process. Incorporate opponent-adjusted metrics to account for schedule strength, ensuring your projections reflect true talent levels rather than inflated or deflated raw numbers.
Spotting Value Opportunities with 2026 Examples
Value emerges when your calculated probability exceeds the implied probability from the odds. Consider a hypothetical 2026 matchup where a strong home team is listed at -4.5 despite recent defensive lapses against elite offenses. If your model projects a 58 percent win probability for the favorite after adjusting for rest and travel, the line offers positive expected value at standard juice.
Another example involves totals: when public attention focuses on high-scoring teams during nationally televised games, totals may inflate beyond realistic projections. Researching pace-adjusted efficiency reveals opportunities on the under, particularly when both teams rank in the bottom quartile for defensive efficiency on the road. A third scenario appears in player prop markets where usage rates spike due to teammate absences; cross-referencing minutes trends with efficiency per minute uncovers mispriced overs or unders before lines adjust.
Actionable Steps and Research Checklist
Follow this expanded process to ensure thorough coverage before committing to any wager. First, compile the full schedule and injury data from official sources, then layer in advanced metrics from multiple databases. Second, calculate team efficiency metrics and project outcomes using at least two independent models for cross-validation. Third, compare your projections against current lines at multiple books while noting any discrepancies greater than one point.
Fourth, monitor line movement for sharp signals over 24 to 48 hours leading up to tip-off. Fifth, assess public betting trends via consensus reports and adjust for overreaction bias. Sixth, confirm value by recalculating implied probabilities and documenting your edge size. Seventh, record results and adjust models accordingly after each slate of games. This checklist builds accountability and refines accuracy over the long 2026 season.
Conclusion
Consistent success in NBA betting odds research for 2026 stems from methodical data collection and objective analysis. By following the outlined steps and applying checklists to real scenarios, bettors can systematically identify opportunities while managing risk responsibly. Regular review of past wagers against projected edges accelerates improvement and highlights areas needing deeper research focus.
Frequently Asked Questions
How often should I update my NBA research models?
Update models weekly during the season and daily for high-profile games to incorporate the latest injury and performance data. Daily updates become essential during playoff pushes when rest decisions and load management alter projections significantly.
What common mistakes should I avoid in odds research?
Avoid relying solely on season averages or chasing lines without verifying sharp movement indicators first. Another frequent error is ignoring contextual factors like back-to-back scheduling or referee tendencies that influence totals more than raw offensive output.
Can research techniques transfer across different sports?
Core principles of line interpretation and data sourcing apply broadly, though sport-specific metrics require tailored adjustments. Efficiency ratings and movement tracking remain useful concepts whether analyzing basketball, football, or tennis contests.
How do I handle late-breaking injury news in 2026?
Establish a routine of checking official injury reports within two hours of tip-off and maintain a secondary set of adjusted projections ready for quick recalculation when key players are ruled out.
What role does bankroll management play in research-driven betting?
Research identifies edges, but proper sizing ensures those edges compound over time. Allocate smaller percentages to higher-variance spots and larger portions only when multiple confirming signals align with your model output.

No comments yet. Be the first!