 GambleLore
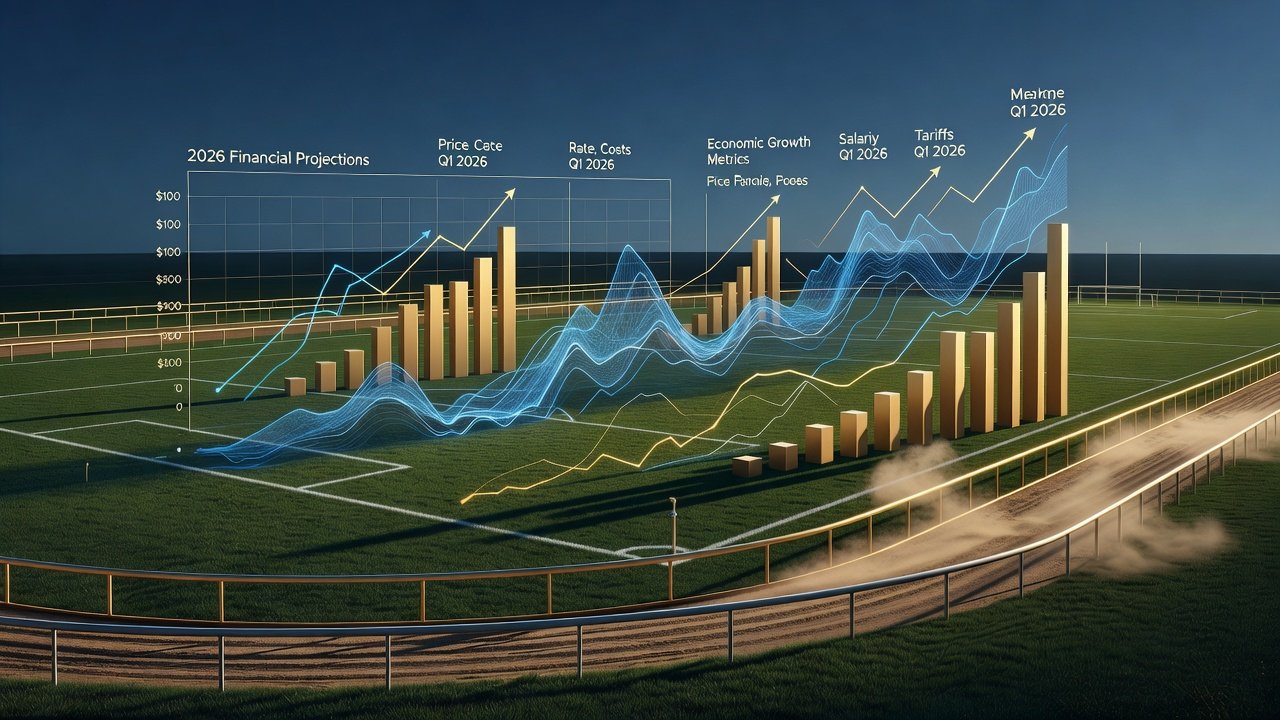
Introduction to Economic Shifts in 2026 Betting
Advanced bettors understand that macroeconomic variables such as inflation, interest rate adjustments, and shifts in consumer spending patterns exert measurable influence on betting odds and market liquidity. In 2026, these dynamics demand precise, data-driven recalibrations to protect bankrolls and identify value opportunities rather than relying on generic strategies. This guide provides concrete methods for adapting to these changes, focusing on practical analysis of odds movements in soccer and horse racing.
Understanding Macroeconomic Factors Affecting Betting Markets
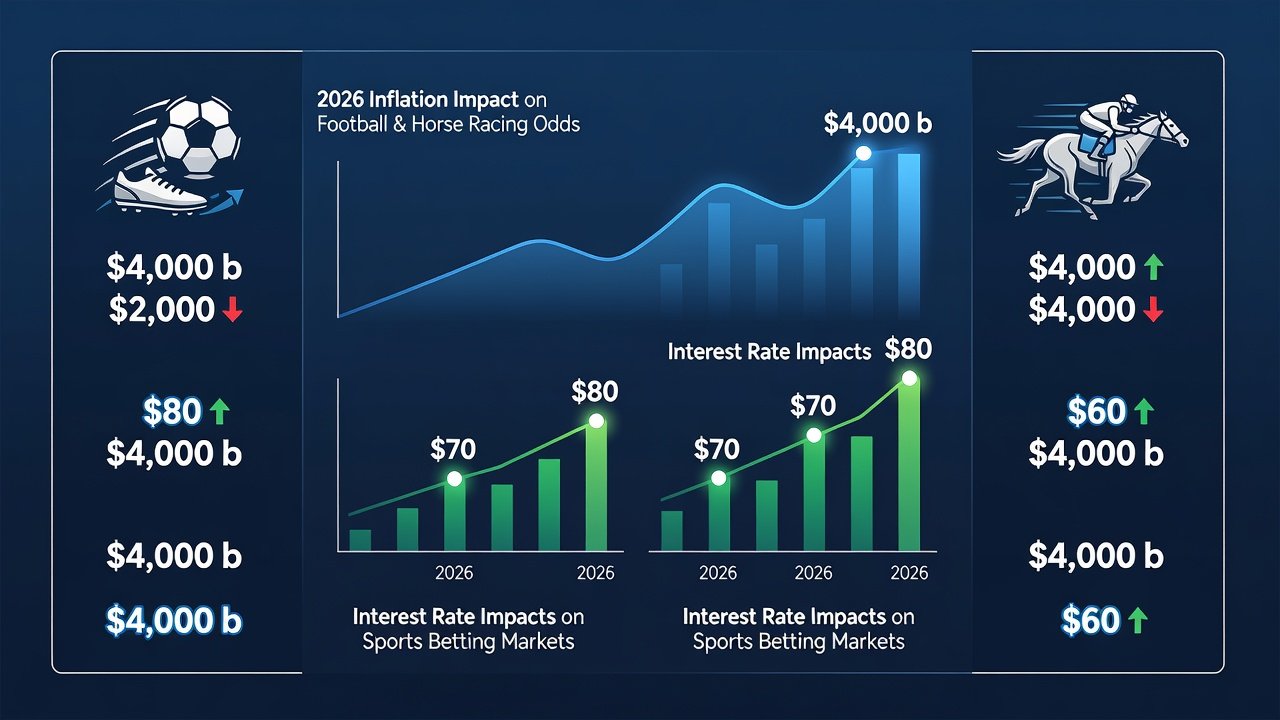
Inflation erodes purchasing power and often leads to reduced discretionary spending on leisure activities including betting. Rising interest rates can tighten credit conditions, prompting bettors to adopt more conservative staking approaches. These factors alter pool sizes and public betting patterns, creating opportunities for those who monitor economic releases systematically. Bettors must integrate indicators like consumer price indices and central bank policy statements into their workflows to anticipate line movements before they become widely recognized.
Step-by-Step Analysis of Odds Shifts Due to Consumer Spending
Consumer spending data serves as a leading indicator for betting volume changes. Begin by sourcing monthly retail and entertainment expenditure reports. Cross-reference these with historical betting handle figures from comparable economic environments. Next, evaluate how reduced spending correlates with decreased public support for favorites, which frequently inflates odds on underdogs and draws. Finally, validate findings against real-time odds from multiple sportsbooks to confirm mispricings.
Detailed Process for Soccer Matches
- Collect consumer confidence and retail sales statistics from reliable economic sources and compare them to the prior season's equivalent periods.
- Analyze pre-match odds for leagues such as the Premier League or La Liga, noting any systematic drift toward lower totals or defensive outcomes during high-inflation intervals.
- Identify value bets by calculating implied probabilities and contrasting them with your own models adjusted for spending trends.
- Document results over multiple matchweeks to refine the correlation strength between economic signals and actual outcomes.
Example: In a 2026 Bundesliga fixture between two mid-table sides, elevated inflation data coincided with heavier public betting on the home team. This created overlay value on the away side plus draw at adjusted odds, yielding positive expected value when consumer spending reports indicated caution among fans.
Detailed Process for Major Horse Racing Events
- Track track attendance metrics and pari-mutuel handle reports alongside fuel price and travel cost indicators that influence discretionary outlays.
- Adjust exotic bet sizing based on projected pool compression during periods of elevated interest rates.
- Target place and show wagers on mid-priced runners when favorite-heavy betting patterns emerge due to risk-averse public behavior.
- Perform post-event reviews to quantify how economic announcements altered final payouts compared to pre-race expectations.
Example: At the 2026 Breeders' Cup, rising rate announcements led to smaller win pools on short-priced runners. Advanced bettors who recalibrated toward exacta and trifecta combinations on longer-priced horses captured enhanced returns as the public conserved capital on high-probability outcomes.
Risk Mitigation Checklists for Long-Term Bankroll Protection
Implement structured checklists to safeguard capital across volatile economic cycles. Review your total bankroll allocation against inflation-adjusted benchmarks on a weekly basis. Limit single-event exposure during weeks containing major central bank announcements. Maintain separate tracking spreadsheets for soccer leagues and racing circuits to enable rapid seasonal recalibration. Always cross-verify odds movements against official economic calendars before committing larger stakes. Additionally, set predefined stop-loss thresholds that trigger reduced activity when key indicators exceed tolerance levels.
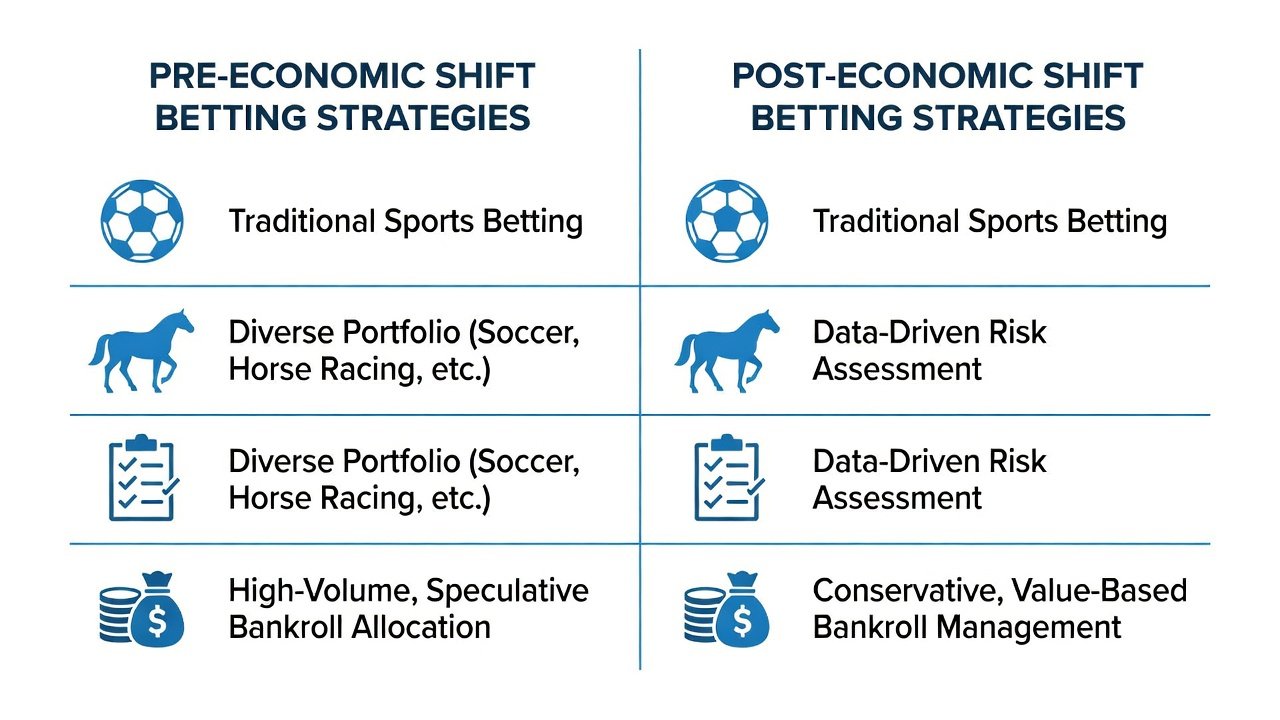
Pre- and Post-Shift Strategy Comparison Table
| Aspect | Pre-Shift Strategy | Post-Shift Strategy |
|---|---|---|
| Bankroll Management | Fixed unit sizing across all markets | Dynamic sizing scaled to inflation metrics and rate volatility |
| Market Selection | Focus on high-volume favorites for volume betting | Prioritize contrarian value on underdogs and exotics |
| Monitoring Frequency | Weekly performance reviews | Daily integration of economic releases and odds drift analysis |
| Staking Approach | Uniform stakes regardless of external conditions | Reduced stakes during announcement windows with tiered recovery plans |
| Record Keeping | Basic win-loss logs | Detailed correlation logs linking economic data to betting results |
Monitoring Key Indicators Including Interest Rates
Central bank policy decisions remain pivotal. Federal Reserve updates deliver authoritative rate guidance that frequently precedes odds adjustments in major markets. Supplement these with broader analyses from IMF economic outlooks for international context. Additional indicators include consumer price index releases, unemployment trends, and retail sales figures. Establish automated alerts for these releases and allocate dedicated review time immediately following publication to detect early odds shifts.
Seasonal Recalibration Techniques
Conduct quarterly recalibrations by updating your predictive models with the latest inflation and rate data. Diversify across low-volatility markets such as soccer draws or horse racing place bets during periods of pronounced uncertainty. Rebalance bankroll segments seasonally, allocating a portion specifically for opportunistic plays triggered by economic events. Test recalibrated models on historical datasets before live deployment to ensure robustness.
Common Mistakes to Avoid
- Ignoring the lag between economic announcements and observable odds movements.
- Over-adjusting stakes based on single data points without multi-month validation.
- Failing to account for sport-specific responses, such as differing impacts on soccer versus thoroughbred racing.
- Neglecting to maintain detailed logs that allow pattern recognition over time.
FAQs on Monitoring Key Indicators and Adaptation
How frequently should interest rate news be reviewed?
Check official releases at minimum twice per week plus immediately after scheduled announcements to capture rapid market reactions.
Which indicators most reliably predict soccer betting shifts?
Retail sales figures, consumer confidence indices, and unemployment rates demonstrate the strongest historical correlations with odds drift.
Do horse racing adaptation methods apply to other sports?
Core techniques involving pool analysis and contrarian positioning transfer effectively but require league-specific and event-specific calibration for optimal results.
What is the recommended approach for seasonal recalibration?
Perform structured quarterly reviews incorporating updated economic data, followed by back-testing and gradual implementation of adjusted staking rules.
Conclusion
Integrating these detailed analytical frameworks enables advanced bettors to navigate 2026 economic shifts with greater precision. Consistent application of step-by-step methods, expanded checklists, and ongoing monitoring supports sustained bankroll protection while uncovering value in soccer and horse racing markets.

No comments yet. Be the first!