 GambleLore

Introduction
In 2026, intermediate casino players are increasingly moving beyond myths and intuition by harnessing their own gameplay data to refine strategies for blackjack, roulette, and baccarat. Personal data reveals true win rates, variance patterns, and effective bet adjustments that generic advice cannot provide. This comprehensive guide delivers actionable methods to log bets, analyze results, and iterate tactics sustainably. By treating your play like a personal research project, you can build approaches that evolve with your results rather than relying on outdated tips or luck-based thinking. Throughout this article, we explore practical tools, real-world examples, and structured processes that help turn raw session notes into strategic improvements.
Why Player Data Matters in 2026
Modern casino gaming emphasizes evidence over superstition. Tracking your sessions highlights strengths and weaknesses across different games and conditions. For example, you might discover that your blackjack decisions improve after certain bankroll thresholds while roulette patterns shift with table limits. Data also supports responsible play by identifying when losses accelerate. In an era where online and land-based casinos offer more analytics tools than ever, players who ignore their personal metrics risk falling behind those who use data to make informed choices. Over time, consistent logging creates a feedback loop that sharpens decision-making and reduces emotional betting.
Setting Up a Simple Spreadsheet for Data Logging
Start with a free tool like Google Sheets or Excel. Create columns for date, game type, session duration, starting bankroll, ending bankroll, number of bets, average bet size, win/loss outcome, and notes on specific tactics used. Add formulas for win rate (wins divided by total decisions) and return on investment. Update entries immediately after each session to maintain accuracy. Include dropdown menus for game variants and bet types to speed up logging. Over 20–30 sessions, patterns emerge that single plays obscure. Consider adding a separate tab for monthly summaries that automatically pull data from daily logs using simple SUM and AVERAGE functions. This setup allows you to filter by game or time period and quickly spot trends such as declining performance after long sessions.
For a practical example, imagine a row showing blackjack on 2026-09-15 with 45 hands played, a 52 percent win rate, and a note about sticking strictly to basic strategy during the first hour. Repeating this process builds a dataset that becomes more valuable with each entry.
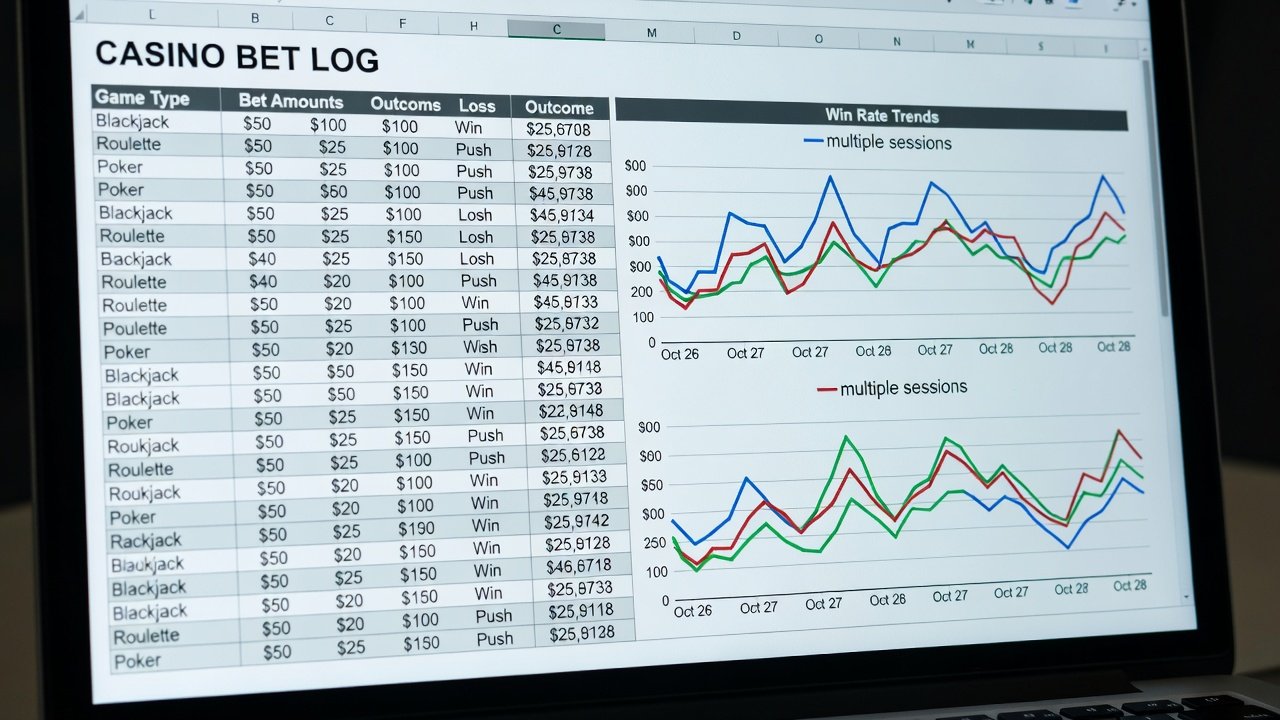
Tracking Bets and Analyzing Win Rates in Blackjack
Log every hand’s starting total, dealer upcard, your action, and outcome. Calculate basic strategy adherence percentage and deviation impact. Review monthly to see if splitting pairs or doubling down correlates with higher returns. Adjust by increasing frequency of proven moves while reducing risky deviations. Break down your data further by tracking performance against specific dealer upcards like ace or ten. This reveals whether you are over- or under-aggressive in certain matchups. For instance, one player discovered through 200 logged hands that their win rate dropped 8 percent when deviating from basic strategy on soft 18 versus a dealer nine, leading them to eliminate that play entirely.
Spotting Patterns in Roulette Strategy Sessions
Record wheel type, bet selections, and streak lengths. Plot results to identify whether outside bets hold steadier than inside numbers over time. Use conditional formatting in your spreadsheet to highlight sequences of five or more losses, helping you decide when to pause or switch table styles. Compare European and American wheels if you play both, noting how the extra zero affects your long-term percentages. Many players find that their data shows outside bets like red/black maintain steadier short-term results while inside bets require stricter session limits to avoid rapid bankroll erosion.
Refining Baccarat Tips Over Time
Track banker versus player bets alongside tie frequency. Note shoe composition indicators if available. After 50 sessions, compare win percentages across different bet progressions. Discard methods that show consistent negative drift and double down on those maintaining positive expectancy within your risk tolerance. Pay special attention to how your results change when switching from flat betting to mild progressions. Data often shows that aggressive increases after wins lead to larger drawdowns during losing streaks common in baccarat shoes.
Integrating Data with Bankroll Management
Use your logged results to set dynamic betting limits. If analysis shows your average loss per hour exceeds a certain threshold, reduce session length or bet size accordingly. Create alerts in your spreadsheet that flag when your 10-session rolling win rate falls below your overall average. This proactive approach prevents small losing streaks from becoming large ones and supports longer-term sustainability.
Practical Before-and-After Strategy Tweaks
Player A reduced average bet size by 15 percent after data showed variance spikes during high-stakes hands, improving session longevity by 40 percent. Player B switched from aggressive martingale to flat betting in roulette after logs revealed rapid drawdowns, stabilizing monthly returns. A third example involves a baccarat player who noticed through 80 sessions that banker bets performed 3 percent better during evening play; they adjusted their schedule and saw improved overall results without increasing total hours played.
Common Data Pitfalls: FAQ
- How many sessions do I need before trusting trends? Minimum 25–30 varied sessions to filter noise and establish reliable baselines.
- Should I ignore small sample sizes? Yes—focus on aggregate metrics rather than single-night outliers that can distort your view.
- What if emotions skew my notes? Log facts only during play and review objectively later when detached from the session outcome.
- Is software necessary? Spreadsheets suffice for most players; advanced tools add complexity without proportional benefit initially.
- How often should I review my data? Conduct weekly quick scans and a deeper monthly analysis to catch issues early.
- Can data tracking make gambling less enjoyable? Many players report the opposite—seeing measurable progress turns sessions into skill-building exercises.
Building Sustainable 2026 Approaches
Combine your data insights with disciplined bankroll rules and regular breaks. Revisit your spreadsheet every quarter to update strategies based on new patterns. This iterative process ensures your methods remain relevant as casino conditions or your own playing style evolve. Remember to cross-reference findings with established responsible gaming principles from authoritative sources.
Conclusion
By consistently logging and reviewing your data, you build personalized 2026 strategies grounded in reality. Combine this with World Health Organization guidance on healthy gaming habits and insights from CDC resources for balanced decision-making. Start small, stay consistent, and let your results guide continuous improvement while maintaining control over your overall experience.


No comments yet. Be the first!