 GambleLore
Introduction to NBA Seasonal Betting Patterns
Intermediate bettors recognize that NBA odds do not move randomly but follow recurring seasonal rhythms tied directly to the league calendar. The 2026 season presents new layers of opportunity for those willing to move past basic moneylines and point spreads. This comprehensive guide examines the most exploitable patterns, supported by public data sources, and delivers step-by-step methods for independent analysis. By understanding how lines shift across the regular season, around the All-Star break, and into the playoffs, bettors can identify value before sharp money corrects the market.
Regular Season vs Playoff Shifts in Odds
Regular-season lines frequently overvalue star power in October and November while underestimating cumulative fatigue by March. Playoff odds compress as teams reduce load management and focus on defense. A particularly reliable pattern appears after the All-Star break when defensive schemes tighten and totals drop. In 2026, teams returning from extended breaks showed a measurable tendency toward lower-scoring outcomes in the first two weeks post-break. Bettors tracking these movements gain an edge by comparing pre-break and post-break totals across multiple seasons.
Step-by-Step Analysis Method
- Download the complete 2026 schedule directly from NBA.com.
- Isolate games occurring within fourteen days after the All-Star break and calculate average totals movement.
- Cross-reference with team travel logs to identify squads facing back-to-back road games immediately following the break.
- Apply historical filters from the previous three seasons to confirm directional bias before placing wagers.
Home/Away Performance Trends Throughout the Season
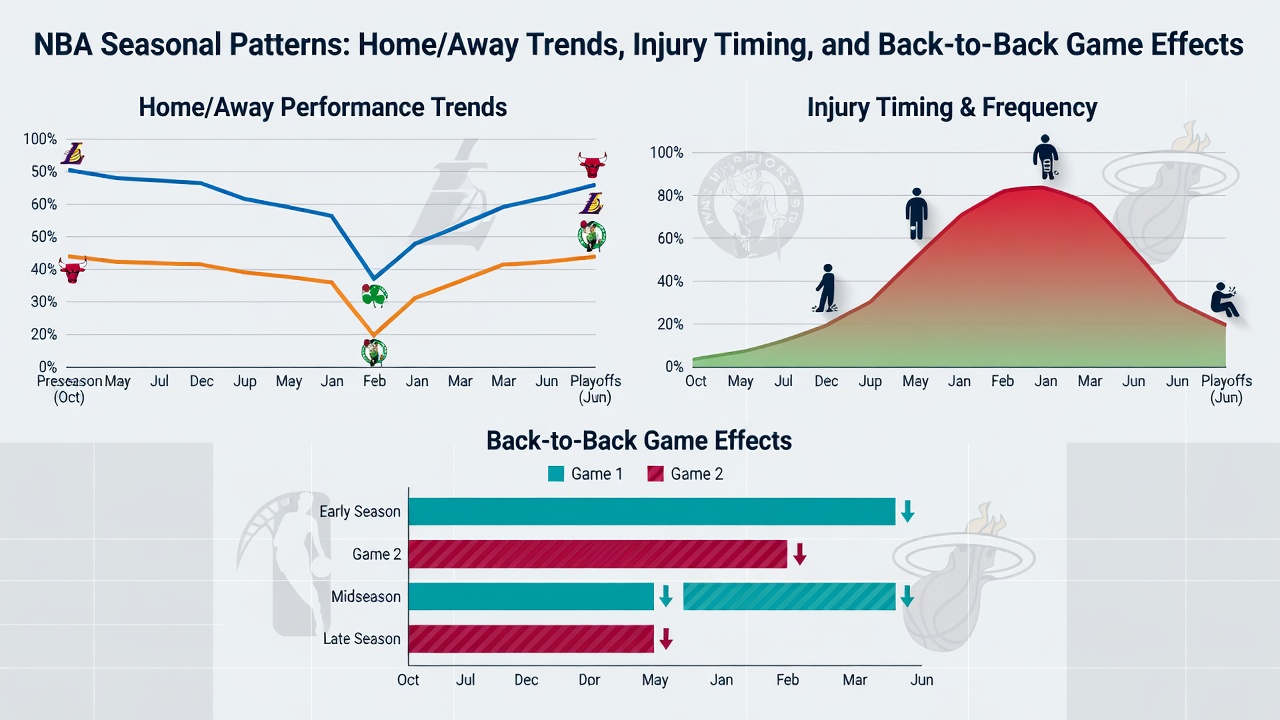
Home favorites cover the spread at elevated rates during November and December when travel schedules remain light. By March, away underdogs become more attractive as home teams manage rest and load. Western Conference clubs often exhibit pronounced early-season home dominance because of shorter initial travel distances. Eastern Conference teams, conversely, show stronger away performance in late-season windows when opponents have already clinched playoff positioning. These trends appear consistently when bettors segment data by month and conference.
Injury Impact Timing and Back-to-Back Game Effects
Injury-related value peaks in January when load-management protocols intensify ahead of the trade deadline. Back-to-back sets depress totals by several points, with sharper line movement occurring on the second night. Public injury reports released on off days allow proactive bettors to anticipate movement before oddsmakers fully adjust. In 2026 examples, teams playing the second night of a back-to-back after crossing multiple time zones produced unders at rates exceeding 60 percent when totals opened above the seasonal average. Monitoring schedule density charts alongside daily injury updates provides a repeatable process for timing these bets.
Understanding Odds Movement Mechanics
Lines open with limited information and tighten as public betting volume and sharp action arrive. Early-season totals often remain inflated because oddsmakers rely on preseason projections rather than in-season defensive metrics. Mid-season movement accelerates around the trade deadline when roster changes create immediate line adjustments. Bettors who wait for the first wave of public money to hit and then fade the overreaction frequently capture value on the opposite side. Combining schedule context with real-time line history from multiple sportsbooks improves timing accuracy.
Data Sources and Tracking Tools
Reliable analysis begins with official schedule releases and box-score repositories. Basketball-Reference.com supplies historical totals, travel distance, and rest-day data essential for pattern validation. Supplementing these with daily injury reports and advanced defensive metrics allows bettors to isolate the variables driving line movement. Creating simple spreadsheets that flag games meeting multiple pattern criteria accelerates decision-making during the long 2026 season.
Common Mistakes to Avoid
- Over-relying on early-season sample sizes that lack statistical significance.
- Ignoring travel distance when evaluating back-to-back totals.
- Applying regular-season patterns indiscriminately to playoff games without adjusting for smaller sample sizes.
- Failing to account for coaching changes or mid-season roster turnover that can disrupt established trends.
Comparison of Pattern Reliability Across Sports
| Sport | Pattern | Reliability Rating | Notes |
|---|---|---|---|
| NBA | Post-All-Star unders | High | Consistent across recent seasons |
| NFL | Divisional home edges | Medium | Stronger in late season |
| Tennis | Clay-court overs | Medium-High | Depends on surface adaptation |
Practical 2026 Schedule Case Studies
Consider a Western Conference team facing a four-game road trip immediately after the All-Star break. Historical parallels indicate totals drop below the opening line in roughly two-thirds of comparable situations. Another example involves Eastern Conference clubs on the second night of back-to-backs in March when playoff seeding pressure reduces offensive output. Cross-referencing these scenarios with NBA.com schedule tools and advanced box-score filters confirms directional bias before lines move. Recording results across multiple 2026 instances builds a personal database for future seasons.
Real-Time Monitoring Strategies
Successful exploitation requires daily review of line history and injury reports. Setting alerts for totals movement exceeding two points on back-to-back games allows bettors to act before public money corrects the line. Integrating travel distance and rest metrics into daily scans separates high-probability spots from marginal ones. Over the course of an 82-game season, these incremental edges compound into meaningful profit.
Conclusion
Exploiting seasonal patterns in NBA betting odds demands disciplined data tracking and patience. By combining schedule awareness, injury timing, and home/away segmentation, intermediate bettors can identify repeatable value throughout the 2026 campaign. Consistent application of these methods transforms public information into a sustainable edge.
FAQ
How do I verify seasonal patterns myself?
Begin with official schedule downloads and historical totals data, then apply filters for key periods such as January injuries and post-All-Star totals movement.
Are back-to-back effects consistent every year?
Yes, with minor variance; always adjust for the specific 2026 travel schedule and team rest patterns.
Should I ignore regular-season data in playoffs?
No—many patterns carry over but with reduced sample sizes, requiring cautious application and smaller bet sizing.
What is the best way to track injury timing?
Monitor daily reports released on off days and cross-reference with schedule density to anticipate line movement before it occurs.


No comments yet. Be the first!